
Fuel is typically 30–40% of a transport fleet’s operating cost. It is also the line where a gap between the invoice and what actually entered the tank is easiest to create and hardest to prove without data.
In practice fuel monitoring answers three questions: how much fuel genuinely went into the tank, how much left it outside normal operation, and which vehicle or driver sits outside the fleet’s own normal range.
How much fuel actually disappears, and what it means in the budget
Fuel is typically 30–40% of the operating cost of a haulage fleet and rarely less than a quarter in a service fleet. At that share, a few per cent of consumption is not a technical detail but a line you can see in the annual result.
Three phenomena are worth separating, because they differ in scale and in what it costs to fix them. Theft is the most dramatic and the rarest — it concerns individual vehicles and usually ends with a single proven case. Excessive idling is the most widespread and the cheapest to reduce: it needs no investment, only feedback. Driving style sits in between — the gap between a calm and an aggressive driver on the same route reaches well over ten per cent, and it stays closed only for as long as somebody keeps showing it.
That is why the first question in a rollout is not “is somebody stealing” but “what does the perfectly legal part of every day cost us”.
What a sensor will not prove
Measuring a fuel level is physics, not legal evidence, and the limits are worth knowing before anybody builds an accusation on it.
Fuel expands with temperature, so the same number of litres reads differently in the morning and in the afternoon. The liquid moves on bumps and slopes, which is why a single reading taken on a ramp means nothing. Every sensor has a tolerance, and on a tank with an unusual shape the error grows near the bottom and near the filler. This is why the system does not work on single readings but on averaged time windows combined with engine state and position.
The practical conclusion is simple: a single event is an indication, a repeating pattern is proof. Cases that end in a disciplinary conversation rest on a series of events at the same place and the same hour, not on one chart.
How to use this data with the team
Fuel data describes the work of specific people, so the same rules apply as for vehicle tracking: the purpose recorded in the work rules or an official notice, employees informed before the system goes live, and the vehicles marked. In Poland this follows from the Labour Code and the GDPR, and we help prepare the wording.
In practice, how the data is presented matters just as much. A consumption ranking that drivers can see for themselves works better than a summons to the office, because it changes behaviour before anybody has to accuse anybody. A fleet whose first visible result was a dismissal learns to hide data rather than to save fuel.
Feeding the numbers into billing
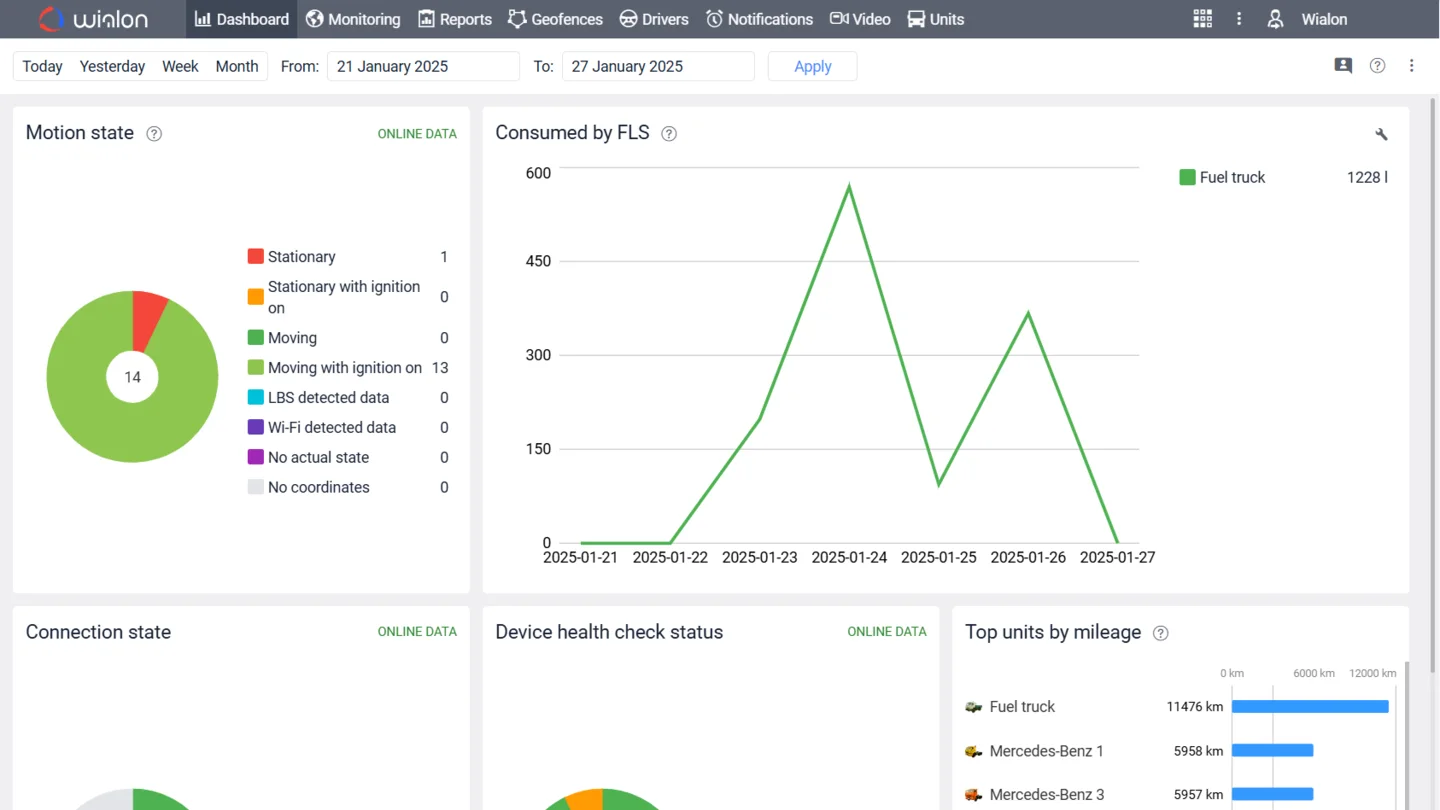
Fuel data is worth something when it reaches the place where costs are counted. Reports export to Excel, and in larger fleets we push them automatically into an ERP or data warehouse through the Wialon platform API. Architecture options are on the Wialon integrations page.
Start with one vehicle
The standard starting scenario: the vehicle you have the strongest suspicions about, plus a reference unit with a similar duty cycle. A month of parallel data is usually enough to size the problem across the fleet and calculate the return. We prepare a quote covering devices, installation and calibration within 24 hours.
Frequently asked questions
How does a fuel level sensor work in fleet telematics?
A capacitive sensor is fitted in the tank alongside or instead of the factory float and measures the level to within a few litres. Readings reach the platform together with GPS position, so every drop in level has a place and a time attached to it.
Is a CAN or OBD fuel reading enough?
In many cars and light commercial vehicles, yes — an OBD tracker reads the factory fuel level and engine parameters. In trucks with large tanks the factory gauge is often too coarse for billing, which is where an additional capacitive sensor earns its cost.
How is fuel theft detected?
The system compares the profile of level changes against engine state and position. A sharp drop with the engine off, parked away from a filling station, is the classic siphoning pattern. The alert carries time, location and volume, which is enough to open a conversation or file a report.
How long does tank calibration take?
Calibration means filling the tank in controlled increments and recording the sensor curve. In practice that is one visit to a filling station, usually one to two hours per vehicle, done around a scheduled refuelling.
Can fuel data reach our accounting system?
Yes. Reports export to Excel, and for larger fleets we push data straight into an ERP or data warehouse through the Wialon API — no monthly manual re-keying.